MySMA Checker
Design, build, and ship a mobile app for spinal muscular atrophy patients in Japan within three months to prevent market share loss to a competitor.
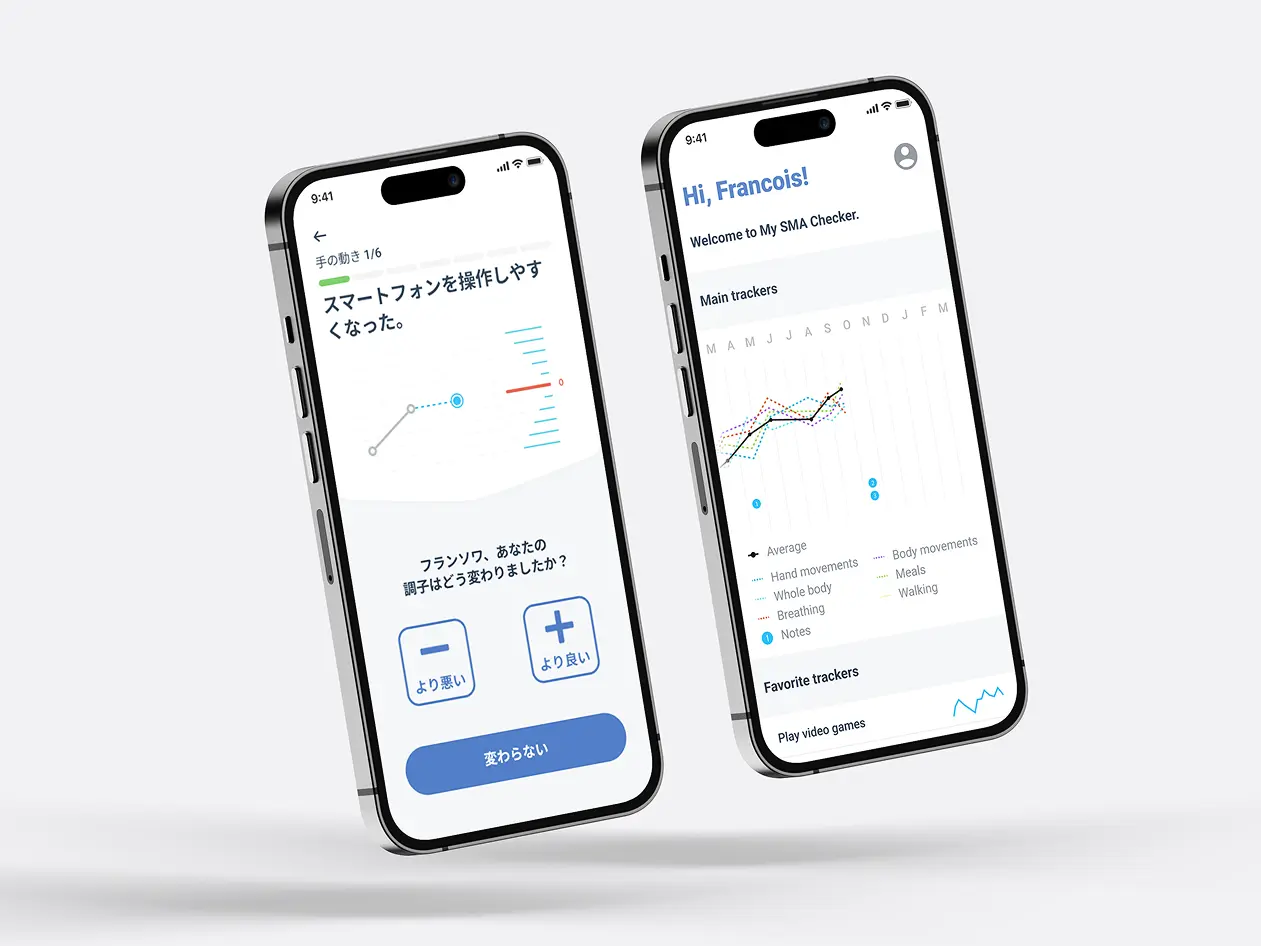
Created a patient-reported outcome tool with a -5 to +5 scale for tracking symptom changes over time, designed to facilitate clinical conversations.
- Application designed, developed, and launched in Japan on schedule - Validated concept with neurologist and medical advisor - Delivered through three two-week sprints with tight collaboration
I designed MySMA Checker, a patient-reported outcomes app for spinal muscular atrophy patients in Japan, delivered in under three months. The core innovation was a -5 to +5 scale that let patients express decline as clearly as progress, unlike typical 0-10 scales. Before touching Figma, I interviewed a Japanese neurologist to understand what data would actually be useful in clinical conversations. The app was built through three two-week sprints and launched on schedule. The key lesson: listening to domain experts before designing anything makes the product honest.
Overview
A rare disease. A competitor threatening to erode market share. A three-month window to design, build, and ship a mobile application in Japan. This was a short engagement, but a meaningful one: an app that would give patients living with spinal muscular atrophy a voice in their own care.

The context
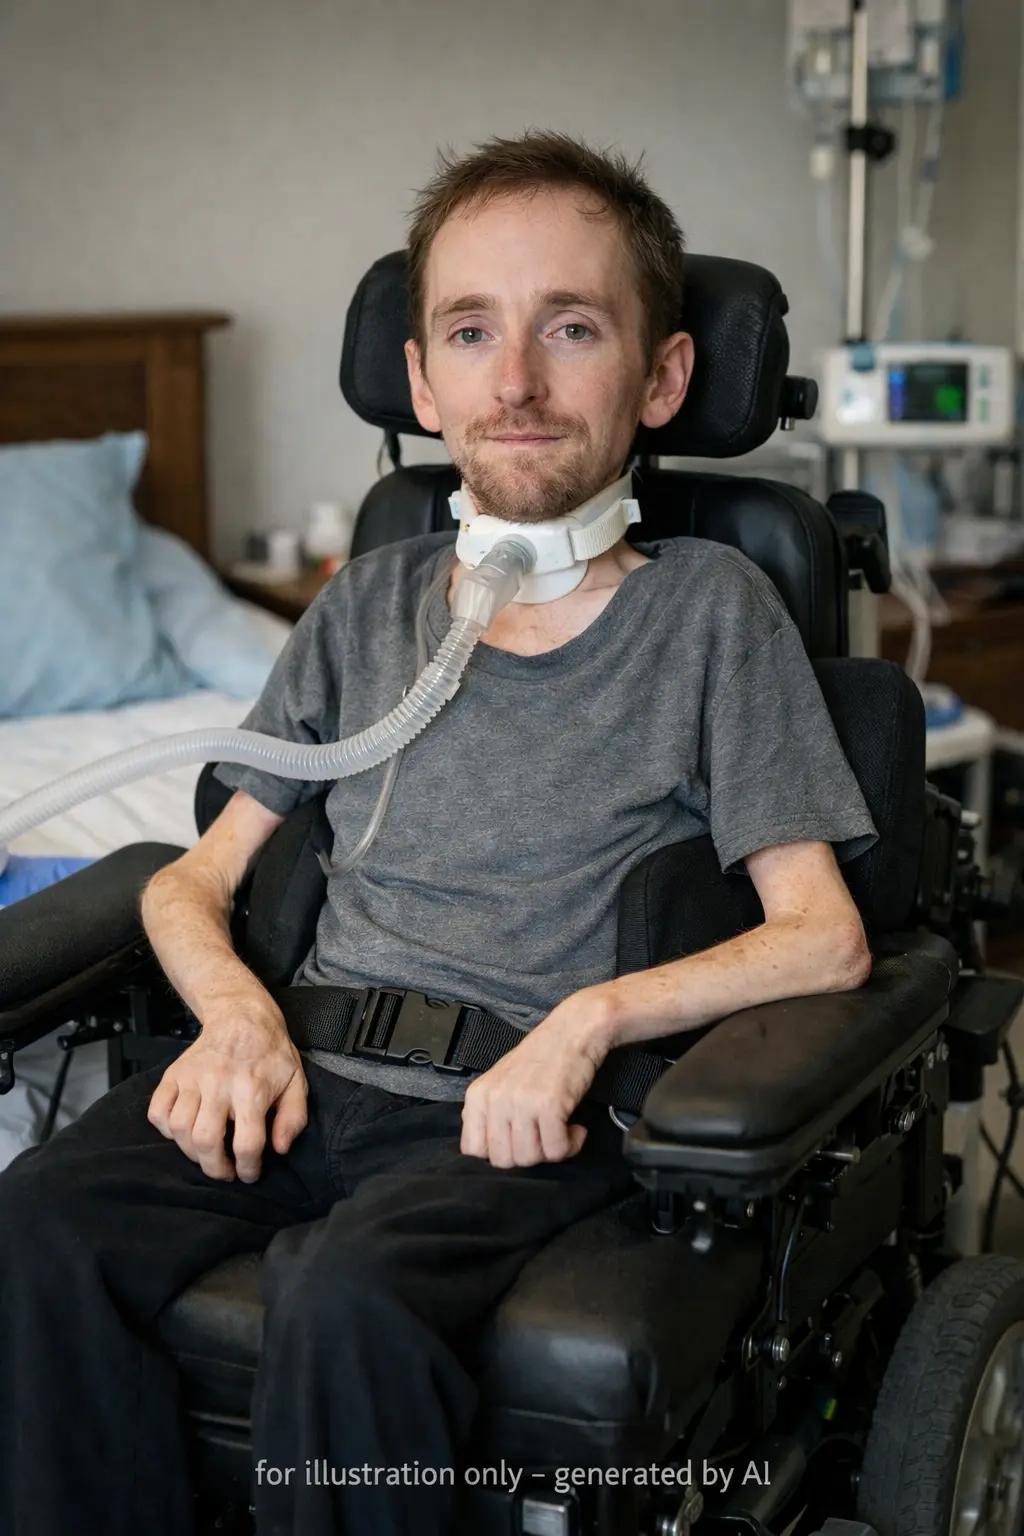
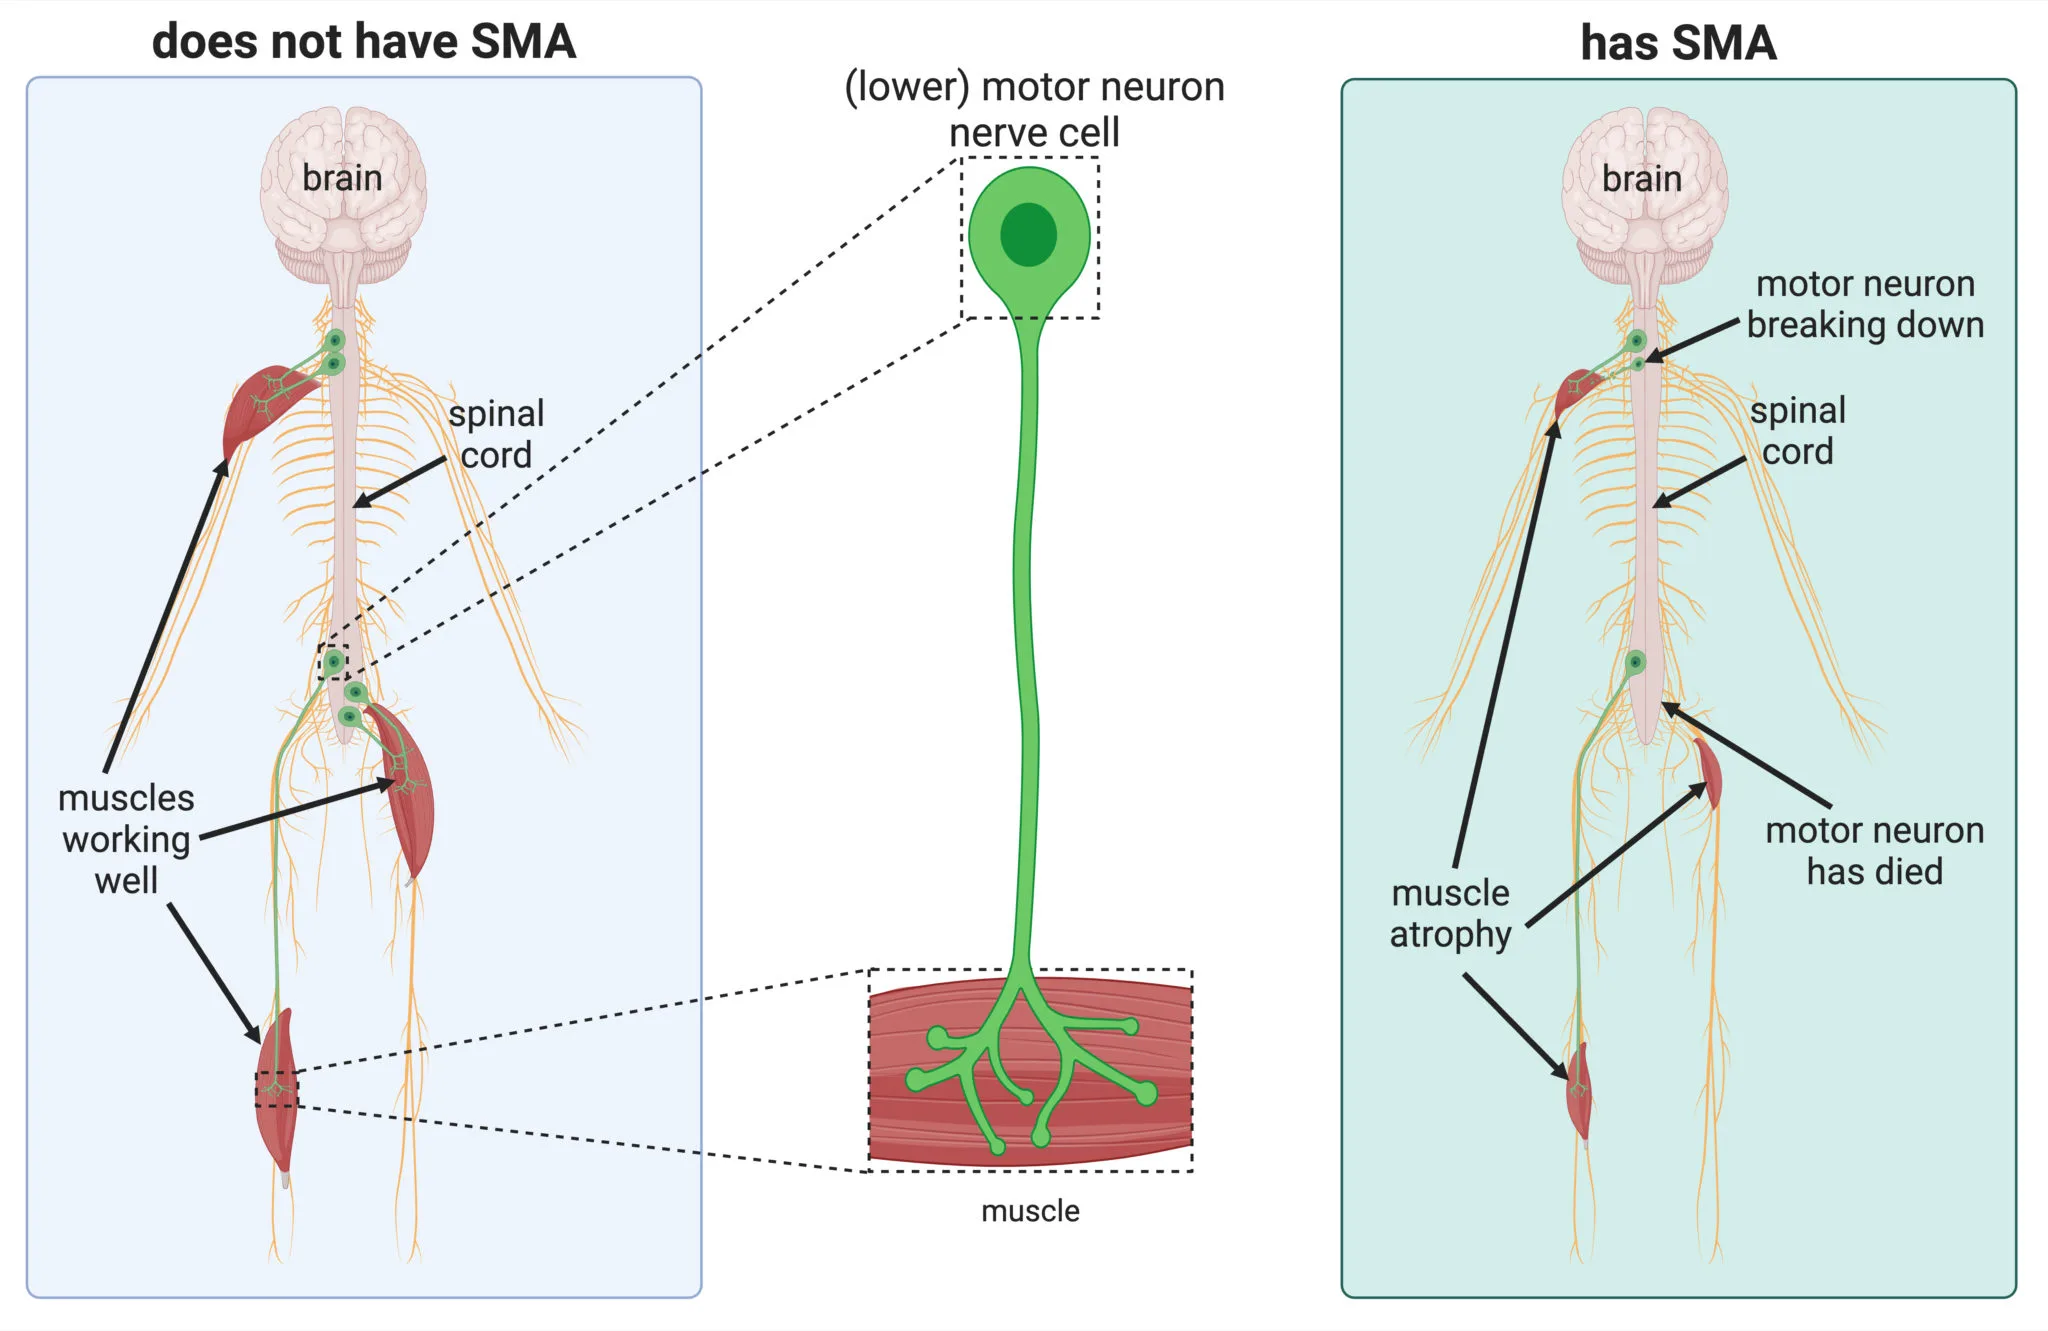
Spinal muscular atrophy (SMA) ↗ is a rare and progressive neuromuscular disease that gradually affects a patient’s ability to move, breathe, and swallow. Biogen offers an effective treatment, but it comes with a significant burden: complex administration, rigorous follow-up, and a demanding relationship with the healthcare system.
In Japan, a competitor had recently entered the market with a lighter alternative. Less effective on the long term, but easier for patients to live with. The threat was real: patients, exhausted by the constraints of Biogen’s treatment, might be tempted to switch, even at the cost of their long-term health outcomes.
Biogen’s response was not to simplify the treatment itself, but to make its value more visible. The idea was to give patients a way to track their own progress over time and to walk into a neurologist appointment with something concrete: data that spoke to their lived experience, not just clinical measurements.
That tool needed to be designed, built, and launched in Japan in under three months.
Learning the disease
I came into the project as a freelance designer with no prior knowledge of SMA. Before touching Figma, I spent time understanding what I was actually designing for.
That meant reading scientific literature, going through clinical reports, and getting access to something more valuable than either: a conversation with a Japanese neurologist who specialised in SMA. She helped me understand how the disease manifests day to day, what patients notice and what they don’t, and crucially, what kind of information would actually be useful in a clinical conversation. Not all symptoms are equal. Not all changes are obvious. Patients often underreport because they lack a reference point for what “normal” was supposed to feel like before the disease progressed.
That conversation shaped everything that came after.
The concept
The core of the application was deliberately simple. Once a month, patients answer a short series of questions about their daily experience, rating each one on a scale from minus five to plus five. The questions are concrete and functional rather than abstract: “I can use my smartphone without difficulty.” “I can hold a glass.” “I can walk to the end of the street.”
The logic behind the scale was important. A neutral zero means no change. Positive scores mean improvement. Negative scores mean decline. Over several months, the curve tells a story that neither patient nor neurologist could easily see in a single appointment.
The monthly rhythm was also deliberate. Frequent enough to capture meaningful change, infrequent enough not to become a burden. SMA patients already carry a heavy clinical load. The application had to feel like something that worked for them, not one more obligation.
Design and delivery
I built an interactive prototype in Figma and validated the concept quickly with the team and the medical advisor. The structure was clean: onboarding, monthly check-in, a personal history view, and a summary designed to be shareable with a neurologist.
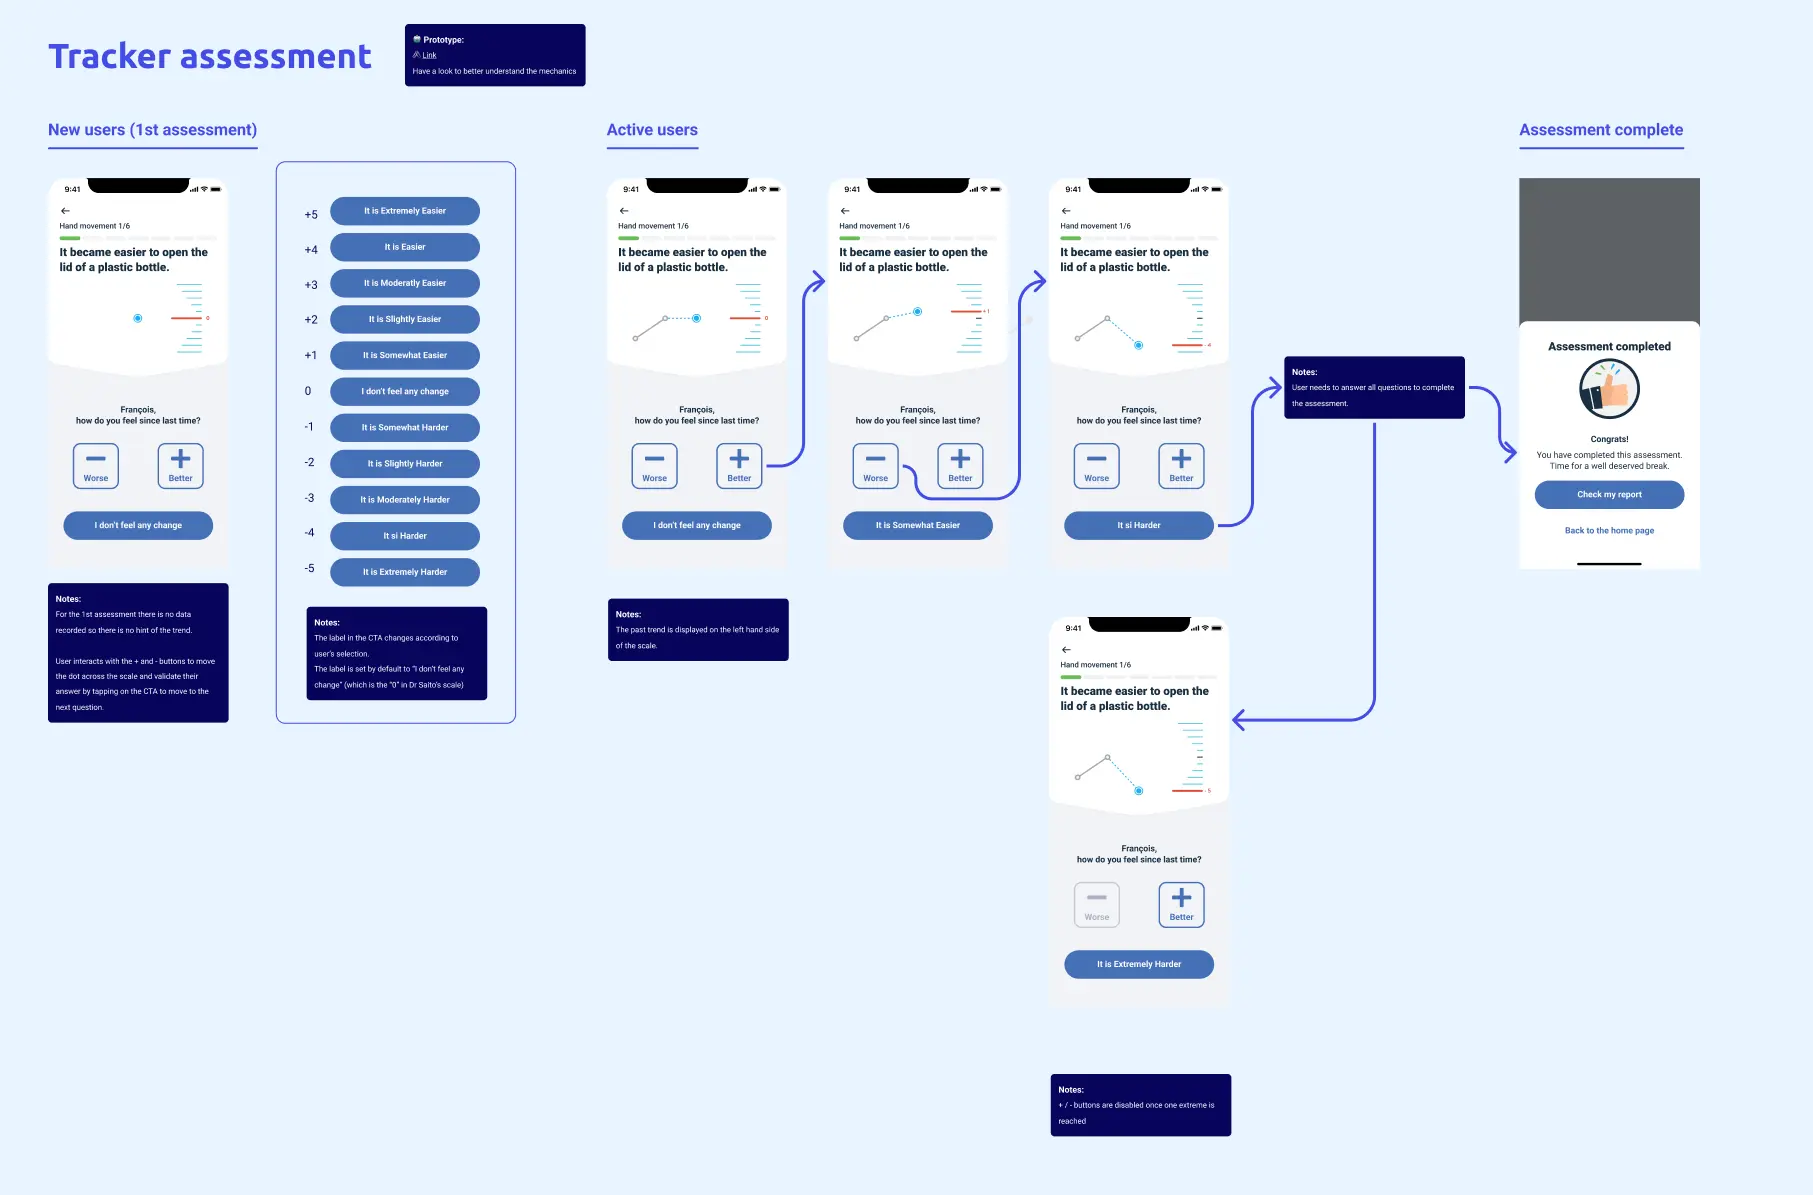
Once the prototype was validated, I worked closely with the frontend and backend developers through three two-week sprints. The collaboration was tight, decisions were fast, and the constraints were real. Three months from brief to live product on the Japanese market is not a comfortable timeline for a medical application. Every scope decision mattered.
The application was functional and launched on schedule.
Reflection
This project was short but it left an impression. Designing for a rare and serious disease is a different kind of responsibility. The users are not frustrated by a clunky checkout flow or a confusing dashboard. They are managing a condition that affects almost everything they can do with their body, and they are often doing it in a system that doesn’t make it easy to be heard.
The simplest design decision, in retrospect, was also the most important: making the scale go from minus five to plus five rather than from zero to ten. It sounds like a detail. But it meant patients could express decline just as clearly as progress, without the questionnaire implicitly assuming that things were only going to get better.
Listening to the neurologist before designing anything was what made that possible. In a short engagement with a fast timeline, it would have been easy to skip that step. It wasn’t the kind of decision that shows up in a sprint velocity chart. But it was the one that made the product honest.
Shipping under a hard deadline in a regulated domain?
Email me with: your domain, timeline, and the constraint you're most worried about.
GET IN TOUCH